
Knowledge and advice
A/B testing on digital screens: measure which content works
A/B testing on digital screens shows which content really converts. Learn how to set up tests, measure them and improve your ROI — including concrete measurement methods.
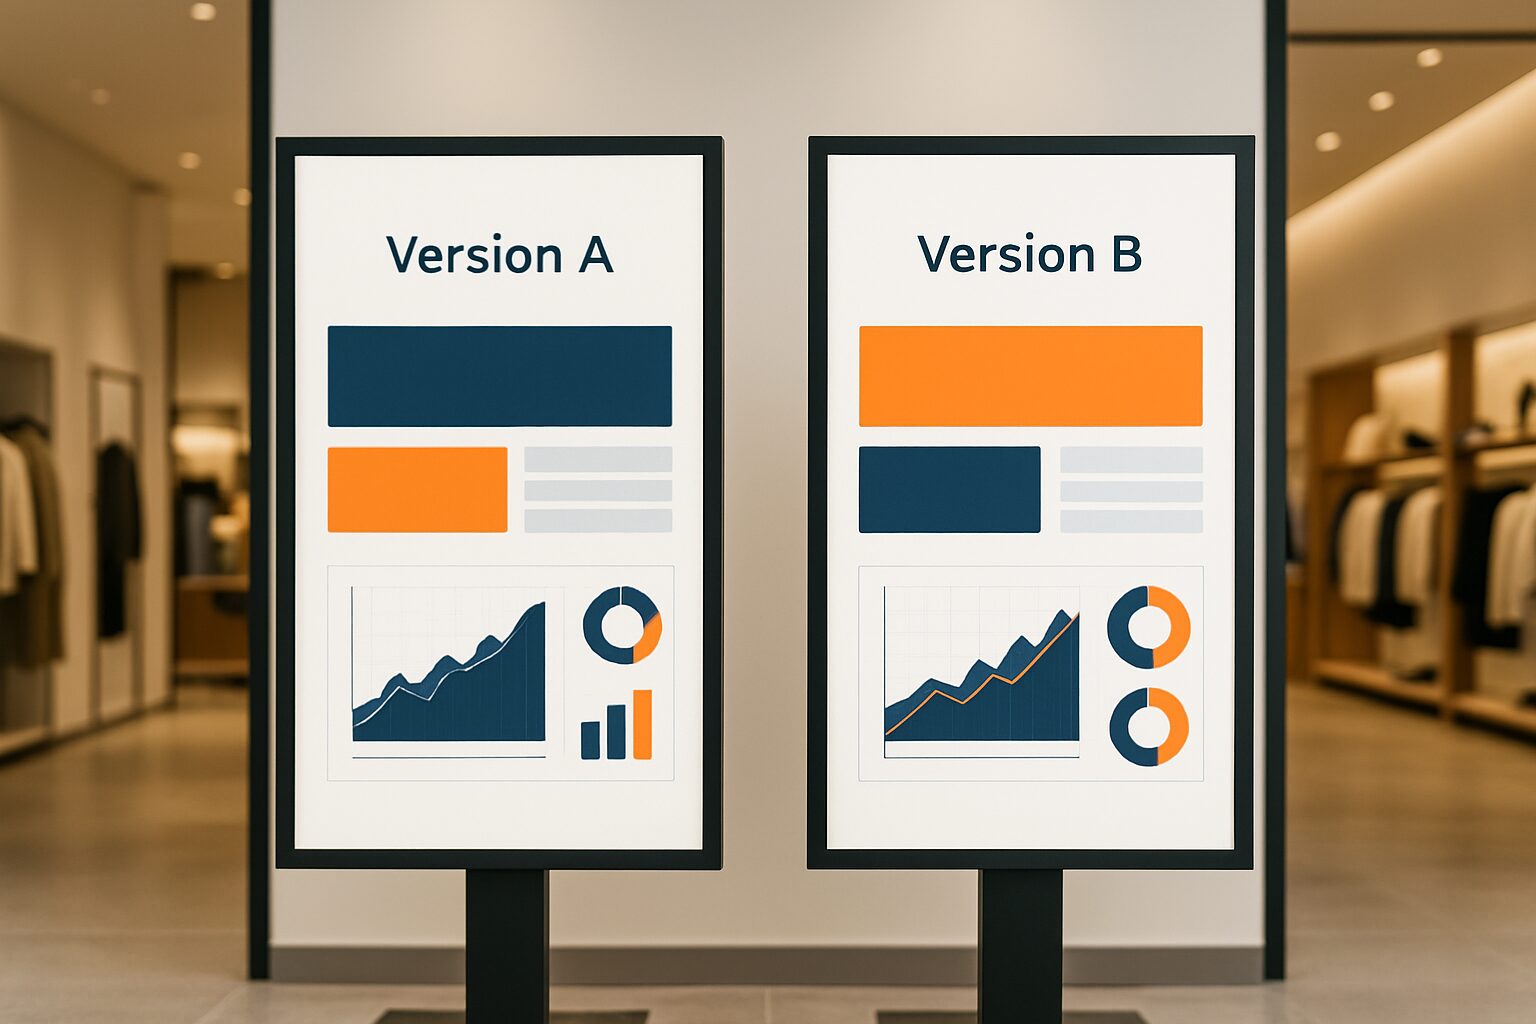
A/B testing on digital screens: measure which content works
A/B testing on digital screens means alternately showing two versions of the same content — differing in image, text, colour or call to action — on the same screen or the same location group. You then measure a preselected KPI: till sales, QR scans, dwell time or interactions on a touch screen. The variant with the better result wins and becomes the new standard. In this way, content decisions shift from gut feeling to evidence.
Why measurement on screens is different from online A/B testing
Online A/B testing works with cookies and session IDs: every visitor consistently sees variant A or B. With a physical screen, that is impossible. Passers-by see what is running at that moment. That calls for a different approach: alternate time blocks (hour A, hour B) or split locations (shop 1 gets variant A, shop 2 variant B).
This has a direct impact on reliability. External factors — day of the week, weather conditions, passer-by volume — affect both variants. Therefore, keep test periods to at least one full week per variant, preferably two. That averages out weekday effects.
According to a study by Kitcast among 515 digital signage operators 76,5% of operators do not formally calculate the ROI of their screens (invidis.com, July 2026). A/B testing is the easiest way to change that — without extra hardware.
What you can test: four variables that make the difference
Start with one variable per test. If you change both the image and the text at the same time, you will not know afterwards which element made the difference.
The four most effective test variables on digital screens:
- Call to action: "Order now" vs. "View the range" — direct language generally converts better for impulse purchases.
- Image type: product photo vs lifestyle image — test which frame appeals to your target audience.
- Display time: morning vs afternoon for the same message — purchasing behaviour differs by time of day.
- Content duration: a slide of 8 seconds vs. 15 seconds — longer slides increase dwell time but reduce the number of displays per hour.
On touchscreens, you add a fifth variable: the position of buttons. A PixioKiosk of 32″ (current price on request, price list Q2 2026) automatically logs every tap in the interaction log. That makes comparing two menu structures concrete: you can see exactly how many visitors click through to a product detail page.
How to set up a test in five steps
Step 1 — Form one hypothesis. Formulate: "If I change [X], I expect [KPI Y] to rise by [Z%]." Without a hypothesis, you measure everything but learn nothing.
Step 2 — Choose your measurement method. Link the test to a measurable signal:
- QR code per variant (unique URL per variant)
- Receipt analysis by product code (ask cash desk staff to mark the promotion period)
- Touch interactions from the device log
- Customer counts via a footfall detector or camera counter
Step 3 — Determine the test duration. Two weeks per variant is the minimum for locations with fewer than 500 daily passers-by. At higher volumes, one week is sufficient.
Step 4 — Keep conditions the same. Run both variants in the same time slots, on the same days. Avoid test periods around public holidays or promotions that distort base behaviour.
Step 5 — Document and decide. Record the result per variant in a simple table. Only choose the winner if the difference is greater than the normal daily variation in your KPI.
Measurement methods by display type
| Screen type | Primary measurement method | Alternative |
|---|---|---|
| Touch kiosk | Interaction log (taps per button) | QR scan per variant |
| Retail display | Cash register turnover by product code | Customer counting |
| Hospitality menu board | Orders per dish | Staff observation |
| Outdoor pavement sign | QR scans (unique URL) | Run counter data |
| Window display | Shop visits (door detector) | QR scan |
A PixioDisplay Pavement Sign (43″, 1.500 nits, current price on request — price list Q2 2026) runs on a battery and has a runtime of 14 to 18 hours. You place it alternately with two different QR codes per part of the day — without a mains connection, so also in locations where you cannot run a cable. The QR statistics from your link tracker give direct insight into which variant generates more scans.
Common mistakes when A/B testing on screens
The most common mistake: stopping too soon. After three days, variant B seems to win, but the difference is not statistically reliable. Keep the test going.
A second pitfall is running two variants on the same screen at the same time without time-slot logging. Then you do not know which variant a specific passer-by saw. Use a content planner that logs which variant was active per time slot.
Third mistake: only looking at impressions. Impressions say nothing about behaviour. Always link a behavioural KPI — a scan, a purchase, a click — to the test. Impressions are a reach metric, not a conversion measure.
When do you start A/B testing?
Start A/B testing once your screen has been running stably for at least two weeks and you have a baseline for your KPI. Without a baseline, you do not know whether an increase is due to the content change or to seasonal influences.
If you have multiple locations, start with a pilot location. Set the winning variant as the default and then roll it out. This is exactly the approach that also works for large-scale deployments — from a single kiosk to a network of screens in multiple branches.
For a complete picture of how to calculate the ROI of your screens and which KPIs are involved, also read the related articles Digital signage ROI: how do you measure the effect of your displays? and 8 KPIs for digital signage that really matter. If you want to know which screen type best suits your test setup, then see the application page for digital advertising screens.
Frequently asked questions
How long should an A/B test on a digital screen run?
Allow at least two weeks per variant for locations with fewer than 500 daily passers-by. For higher volumes, one week is sufficient. Shorter tests provide too little data to draw a reliable conclusion, especially if weekday behaviour differs significantly.
Which KPI should I use if I don't have a till system?
Use a unique QR code per content variant. Every scan is a measurable behavioural moment that you link to the variant that was active at the time. On touchscreens, use the device’s own interaction log — it records every tap per time slot.
Can I A/B test with one screen, or do I need multiple screens?
One screen is enough. You alternate the variants by time slot — for example variant A in the morning, variant B in the afternoon — and record which KPI value belongs to which time slot. Make sure your content planner logs which variant was active for each slot.
What is the difference between A/B testing and simply changing content?
With simple changes, you replace content without measurement. With A/B testing, you set a hypothesis in advance, measure a specific KPI before and after the change, and decide on the basis of data which variant works better. Without that structure, you learn nothing from the change.
Does A/B testing also work for a touchscreen kiosk in a reception area?
Yes. A touch kiosk records every interaction in a log: which button was tapped, how long a user was active, and how many steps were taken. Compare two menu structures over two weeks and see which variant leads more visitors to the desired final page.