
Knowledge and advice
KPIs for digital signage at your trade fair stand: how to measure impact
Which KPIs do you use to measure the impact of digital signage on your trade fair stand? From dwell time to lead conversion — with practical methods for retail & events.
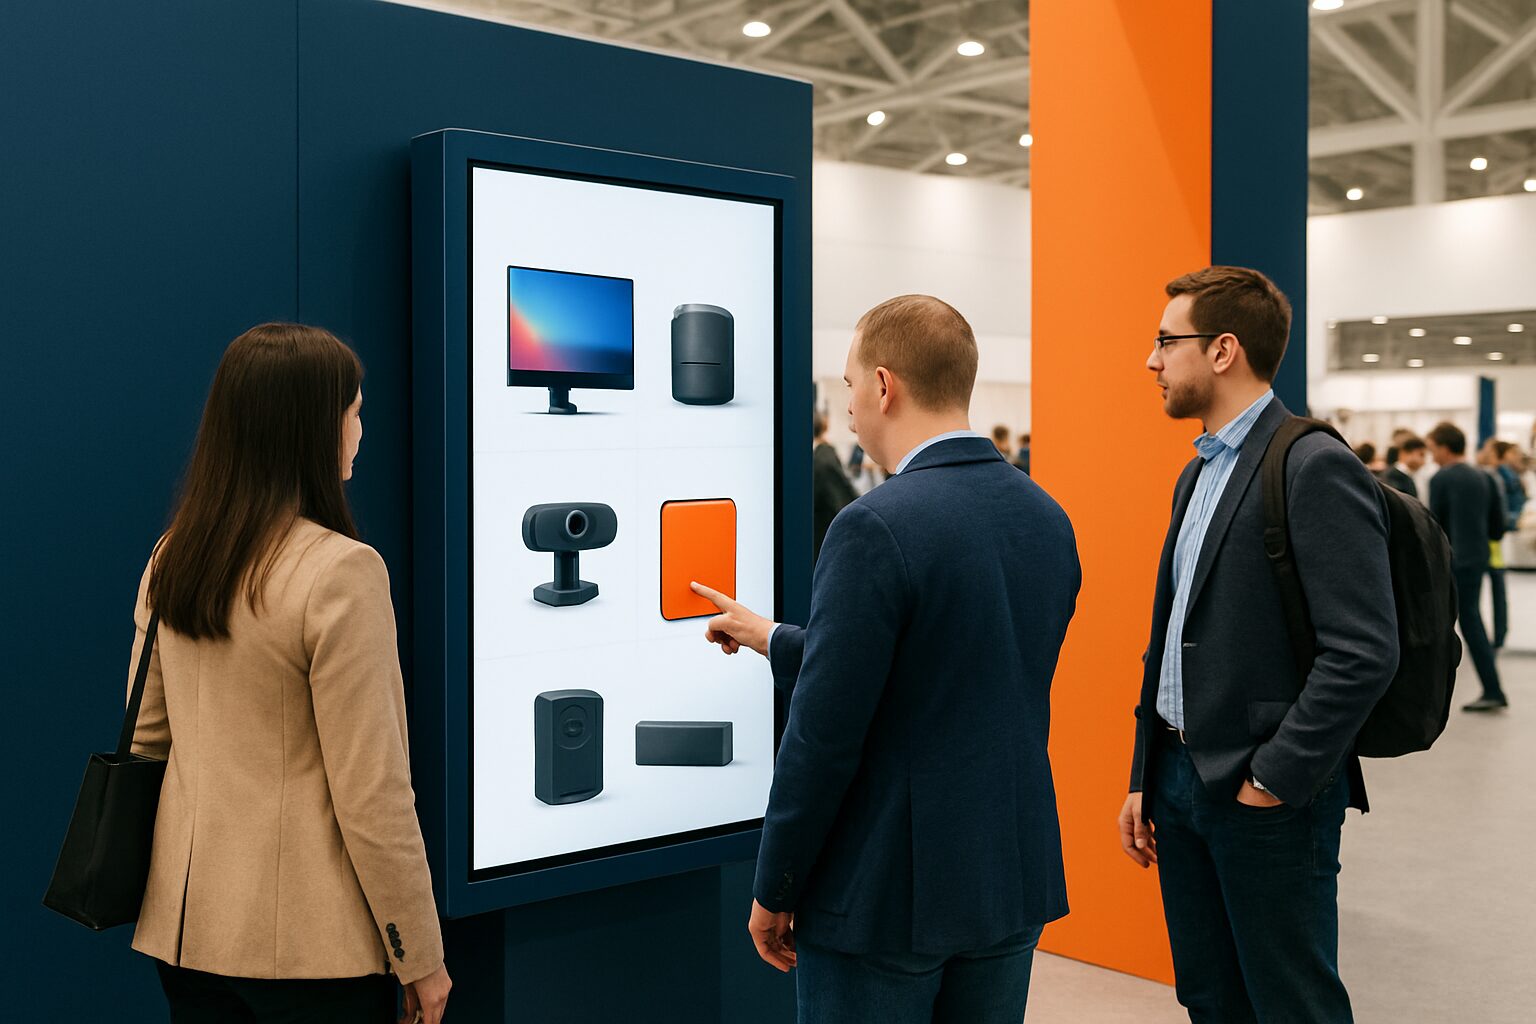
KPIs for digital signage at your trade fair stand: this is how you measure impact
You measure the impact of digital signage on a trade fair stand using KPIs (Key Performance Indicators): measurable values that show whether your screens attract visitors, inform them and prompt action. The five most relevant KPIs are dwell time, stand reach, lead conversion rate, touchscreen interactions and cost per lead. Those who define these indicators before the trade fair can assess afterwards objectively whether the investment pays off.
In short
- Set KPIs before the trade fair — not afterwards. Without predefined goals, measuring is pointless.
- Dwell time (time spent at the stand) is the most direct measure of the appeal of your screens.
- Touchscreen interactions provide quantitative insight into engagement, independent of stand staff.
- Link every KPI to your trade fair objective: lead generation, brand awareness or product launch each require different metrics.
- Hire or buy your displays based on use: the arithmetic break-even point is around 8–10 usage days per year.
Why measuring on a trade fair stand is so difficult
A trade fair stand attracts visitors, but what role did your screen play in that? That is the crux of the issue. Trade fairs are busy environments with lots of stimuli at once. Research shows that visitors spend, on average, only a few seconds assessing a stand before deciding whether to keep walking or stop (source: eldee.com). That makes the first visual impression — and therefore your screen content — decisive.
Measuring ROI at trade fairs is notoriously difficult. RAI Amsterdam already concluded that all exhibitors are looking for ROI, but that it often turns out to be difficult to measure (source: rai.nl). By agreeing clear KPIs in advance and setting up the back office properly, it becomes easier to determine whether an event was worth the effort. Digital signage makes this more concrete: screens generate measurable data that a static stand does not provide.
The 5 core KPIs for digital signage on a trade stand
Not every metric is a KPI. Choose the indicators that directly align with your trade fair objective.
| KPI | What it measures | How to collect it |
|---|---|---|
| Dwell time | Dwell time at the stand (in seconds/minutes) | Manual counting, camera analytics or sensors |
| Stand range | Number of unique visitors entering or passing the stand | Visitor counter, trade fair badge scan, estimate based on footfall |
| Touchscreen interactions | Number of touches, menu choices, downloads on touchscreen | Built-in CMS statistics or app logging |
| Lead conversion ratio | % of visitors who leave contact details or scan a QR code | CRM connection, form on touchscreen, badge scanner |
| Cost per lead (CPL) | Total trade fair costs divided by number of qualified leads | Financial overview after the trade fair |
Always start with one primary KPI that reflects your trade fair goal. Are you aiming for lead generation? Then the lead conversion rate is the key metric. Are you launching a new product? Then dwell time is more relevant than CPL.
Dwell time: the most direct indicator
Dwell time is the time a visitor spends at or on your stand. The longer someone stays, the greater the chance of a conversation and a lead. Digital signage influences dwell time directly: moving images and interactive screens keep visitors engaged longer than a static roll-up banner.
You measure dwell time in three ways. The simplest is a manual count by stand staff using a stopwatch or tally sheet. More accurate are camera systems with people-counting software, which also measure anonymously. Some touchscreen systems automatically record how long a session lasts — that gives a minimum value for dwell time.
A realistic target for a B2B trade fair stand: an average dwell time of 2–4 minutes per interested visitor. If you are well below that, your screen content or stand layout is the first point to improve.
Touchscreen interactions as an objective measure of engagement
A touchscreen kiosk records every interaction. That makes it one of the few truly objective measurement tools on the exhibition floor. You can see which menu items are clicked, which product pages are viewed and how many visitors fill in a contact form or download a brochure.
This delivers three useful insights. First: which products or themes attract the most attention. Second: where visitors drop out in the flow (the 'exit page' of your kiosk). Third: how many direct leads the screen generates without intervention from stand staff.
At the PixioKiosk — available in formats from 21,5″ (current price on request buy) to 49″ (current price on request buy, price list Q2 2026) — you can manage content via USB, website URL or the PixioApp. All interaction data is therefore available for analysis after the trade fair. On the Negenmaandenbeurs bol.com used displays to inform and activate visitors — an example where screen interactions directly contributed measurably to stand activity.
Lead conversion rate: from visitor to contact
The lead conversion rate is the percentage of visitors who complete a desired action: scanning a QR code, filling in a form or having a badge scanned. This is the KPI that translates most directly into commercial results.
A calculation example: suppose your stand attracts 1.000 visitors and 5% leave their details, that results in 50 leads. If those leads on average yield current price on request, you recoup an investment of current price on request (source: beursstand.nl). Digital signage increases this percentage by actively engaging visitors: a QR code on the screen, an interactive form on the kiosk or a lead capture screen that automatically collects email addresses.
Connect your touchscreen to a CRM system. That way, leads are qualified immediately and you no longer have to process a pile of business cards after the trade fair. Read more about lead processing in the article How do you capture leads at a trade fair (and how do you process them).
Measure stand reach and brand awareness
Not every trade fair participation is about direct leads. Sometimes the aim is brand awareness — especially for retail chains present at a trade fair such as Horecava (RAI Amsterdam) or the Jaarbeurs Utrecht. In that case, reach and contact moments are the primary KPIs.
You measure stand reach in three ways:
- Visitor counter: a simple sensor at the stand entrance counts everyone who comes in.
- Trade fair badge scan: at trade fairs with badge scanning, you can link exact visitor profiles to your stand.
- Estimation method: divide the total visitor traffic at the trade fair by the percentage looking towards your stand — a rough but useful proxy.
Digital signage extends your reach beyond the stand boundaries. A bright screen of 400 cd/m² attracts attention from the aisle. Outdoors or in a bright exhibition hall you need more brightness: the PixioDisplay Luxe (49″ touchscreen, current price on request buy or current price on request p.m. lease, price list Q2 2026) is designed for busy environments and attracts visitors from a distance.
For brand awareness, what happens after the fair also matters. Record the number of social media mentions, press releases and LinkedIn posts that refer to your stand. These are soft KPIs, but they give context to the hard figures.
Cost per lead: the financial KPI
Cost per lead (CPL) is the only KPI that evaluates your trade fair participation as a whole. The formula: total trade fair costs (stand, displays, staff, travel costs) divided by the number of qualified leads.
A CPL of current price on request is common for B2B trade fairs in the Netherlands, depending on the sector. If you are above the current price on request per lead, it is worth analysing which parts of your stand are holding back conversions. Often it is not the screen itself, but the call to action on the screen or the follow-up afterwards.
The choice between buying and renting also plays a role here. The arithmetic break-even point is around 8–10 usage days per year: if you go to trade shows more often, buying is cheaper. If you go once or twice a year, renting via display rental financially more advantageous. At Summit, more than 50 PixioDisplays were used at one event — a scale at which hiring was the most efficient choice logistically and financially (reference: Summit).
From data to improvement: the measurement cycle
Measurement only has value if you also use the data. Build in a fixed evaluation cycle: immediately after the trade fair, two weeks later (once leads have been followed up) and after three months (once conversions become visible).
Immediately after the trade fair, compare the hard figures: dwell time, interactions, leads. Two weeks later, add the CRM data: how many leads converted into appointments? After three months, calculate the CPL and the first revenue from trade fair leads. This three-step model gives a complete picture of your ROI.
Adjust your screen content based on the data. If visitors are dropping off en masse on page 2 of your kiosk flow, that page is too complex or not relevant enough. If dwell time is high but lead conversion is low, there is no clear call-to-action. Digital signage is adaptable — use that advantage.
A practical tip: schedule your content updates during trade fair preparation. For this, also read the trade fair preparation checklist of 6 weeks and the article Digital signage at trade fairs: the complete guide to a standout stand.
Conclusion
Measuring impact on a trade fair stand starts with the right KPIs before the fair: dwell time, stand reach, touchscreen interactions, lead conversion rate and cost per lead. Link each KPI to your concrete trade fair objective and use the data afterwards to improve your approach. Digital signage makes this more measurable than any other stand element — provided you actually analyse the data. Start with one primary KPI, add a touchscreen for objective interaction data and build a measurement cycle from there. See the trade fair and event displays from Pixio Display for an overview of displays suitable for any trade fair scale.
Frequently asked questions
Which KPI is most important for digital signage at a trade fair stand?
That depends on your trade fair objective. For lead generation, the lead conversion rate is key: how many visitors leave their details via your screen or kiosk? For brand awareness, dwell time is more relevant. Always set one primary KPI before the fair — not afterwards.
How do I measure dwell time at my trade fair stand?
The simplest method is a manual tally sheet kept by stand staff. More accurate are camera systems with people-counting software or sensors at the stand entrance. Touchscreen kiosks also automatically record how long a session lasts, which gives a minimum value for dwell time.
Can a touchscreen kiosk register leads without stand staff?
Yes. With a touchscreen kiosk with a built-in contact form or QR code, visitors can leave their details independently. Link the kiosk to a CRM system for direct qualification. This also works outside peak times, when stand staff are busy with other visitors.
What is a realistic lead conversion rate at a B2B trade fair?
A common target figure is 3–7% of total stand visitors. That means: out of every 100 passers-by, 3 to 7 visitors leave their details. A well-placed touchscreen with a clear call to action can increase this percentage, because visitors can take action even without speaking to anyone.
How do I calculate the cost per lead of my trade fair participation?
Add up all costs: stand rental, displays, staff, travel costs and build-up. Divide that total by the number of qualified leads. An CPL of €50–€150 is common for B2B trade fairs in the Netherlands. If you are consistently above €300, analyse which part of your stand is holding back conversion.
What is the difference between stand range and dwell time?
Stand reach is the number of unique visitors who pass or enter your stand — a quantitative measure. Dwell time is how long someone stays at your stand — a qualitative measure of engagement. High reach with low dwell time points to an attractive appearance but insufficient content relevance.
Should I buy or rent displays for one trade fair per year?
The arithmetic break-even point is around 8–10 usage days per year. If you go to a trade fair once or twice a year, hiring is financially more advantageous. The PixioDisplay Mobile, for example, is available from €105 per day (3 days, price list Q2 2026). If you go more often, purchase or leasing pays for itself.
How do I use the data from my screens after the trade fair?
Build a three-stage evaluation cycle: immediately after the trade fair (hard figures: interactions, dwell time, leads), two weeks later (CRM data: how many leads converted into appointments?) and after three months (CPL and first revenue). Adjust your screen content based on the findings for the next edition.
Which trade fair venues in the Netherlands are suitable for digital signage with touchscreens?
All major Dutch trade fair venues are suitable: RAI Amsterdam, Jaarbeurs Utrecht, Ahoy Rotterdam, MECC Maastricht and the Brabanthallen in 's-Hertogenbosch. When choosing a venue, pay attention to the available power connections and the maximum display brightness required by the hall — a dark hall requires fewer nits than a bright glass exhibition hall.
Can I also use digital signage for brand awareness instead of lead generation?
Absolutely. For brand awareness, stand reach and contact moments are the primary KPIs. Measure the number of visitors who see your screen, the number of social media mentions after the trade fair and any press releases. Combine this with a strong visual message on a bright screen that also stands out from the aisle.